Purpose
The purpose of this lab is to investigate graphs relating time, position, velocity, and acceleration of a cart traveling down a ramp. Ticker tape will be used to mark position intervals as the cart travels.
Theory
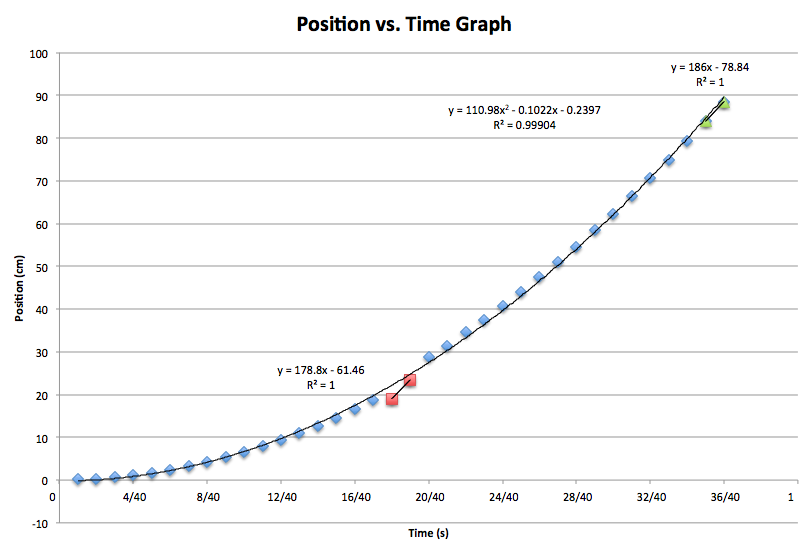
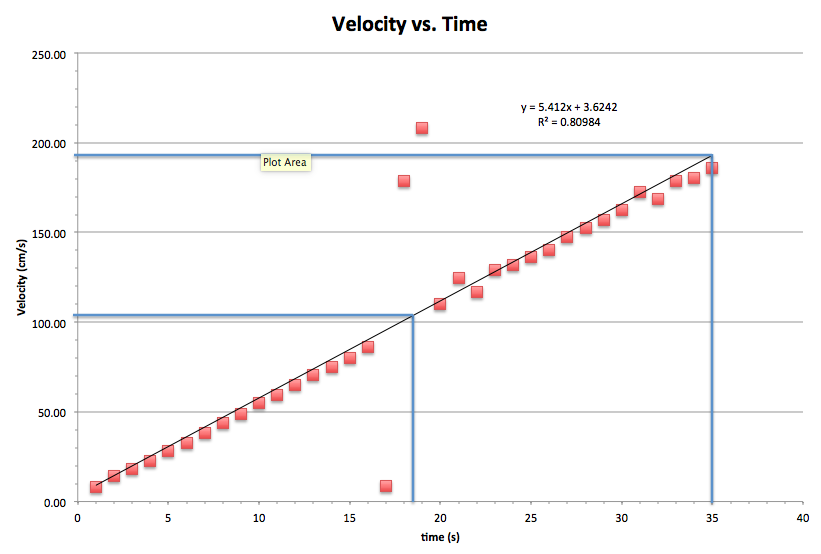
The position versus time graph represents the equation 0=1/2at^2+ViT- d (0=ax^2+bx+c), and the shape of the data resembles a parabola. The velocity versus time graph is a representation of the equation Vf= at+ Vi (y=mx + b). The shape of the points in the data form a linear trendline. Lastly, the acceleration versus time graph does not represent an equation. The line formed by the data points forms a horizontal line, a constant acceleration.
Experimental Technique
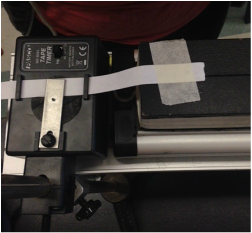

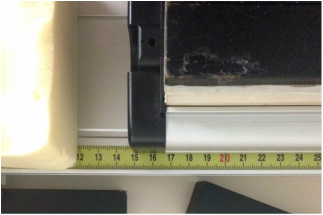
In this lab, we sent a cart down an inclined plane. As the cart traveled downwards, marks were made on ticker tape to record the position of the cart at every 1/40 of a second. Each mark was measured and recorded to make graphs showing velocity, acceleration, and position versus time.
Data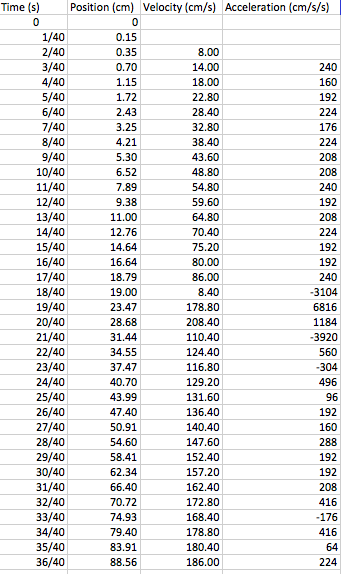

Analysis
velocity at 75 cm= 178.8 cm/s velocity at 15 cm=186 cm/s
velocity at 75 cm= 104 cm/s velocity at 15 cm= 192 cm/s ConclusionIn this lab, we investigated position, velocity, and acceleration graphs for a cart traveling down an incline plane. The cart had a constant acceleration throughout its journey down the ramp. The kinematic equations closely relate to the equations of each line found on the graphs. By rearranging the kinematic equations, we may use them to figure out the acceleration and velocity of the cart based off of the equations of our graph. Data, however, may be slightly incorrect. Reasons for this could be instrumental error, through inconsistency of the ticker time machine. Another source of error would be parallax. Measurements of the dots located on the ticker tape could have been incorrect, causing data to be off. Little friction was encountered during this experiment, so that is not a significant source of error. The trend of increasing noise displayed in the graphs could be a result of growing error in data. Minor error in measurements wouldn't effect position very significantly. As we use data in several different equations, like those to find velocity and acceleration, exactness of data becomes more important and in return shows error more.
|


|
